
Soundscapes to Monitor Habitat Development on Restored Cranberry Farmland
Assessing the Impact of Landscape Context on Acoustic Indices for Monitoring Restored Cranberry Bogs in Plymouth, Massachusetts
Assessing the Impact of Landscape Context on Acoustic Indices for Monitoring Restored Cranberry Bogs in Plymouth, Massachusetts
Honors Thesis Summary
Leonardo Kerz
MAY 2026
Abstract
Passive acoustic monitoring (PAM) provides scientists with a low-cost and scalable approach to monitoring, a critical post-implementation step in the ecological restoration process for evaluating project success. To effectively apply PAM, it is important to study how acoustic indices correspond to landscape context versus habitat quality. The primary objective of this study is to compare acoustic indices with ecological integrity surrounding sampling sites in restored wetlands. Another objective is to assess how well acoustic indices track stages of habitat recovery in sites with varied restoration ages.
Results show that, among the integrity metrics assessed, road traffic intensity and human-created edge effects were strongly associated with acoustic indices. As indicators of broader habitat quality, the Normalized Difference Soundscape Index and Acoustic Complexity Index outperformed all other indices evaluated, correlating with the greatest number of integrity metrics and reflecting restoration age. Acoustic indices also showed independence between landscape quality and restoration age, demonstrating that acoustic analysis can isolate restoration-related habitat recovery.
Study results support the use of acoustics to monitor restored cranberry wetlands, as indices reflect habitat recovery over time and respond to anthropogenic pressures in the landscape. Future research should continue to investigate the most effective methods for applying PAM and indices to optimize their impact in ecological research.
Objectives
1) To assess if there are significant differences between cranberry bog restoration sites using acoustic indices.
2) To assess if acoustic indices correlate with spatial environmental variables surrounding these sites.
3) To assess if wetland and subsequent habitat recovery are observable from acoustic indices in sites of different ages.
Study Area
Three restored wetlands (Eel River Preserve, Tidmarsh Wildlife Sanctuary, and Foothills Preserve) were chosen because of their geographic proximity, similar size, similar restoration designs and objectives, and regular temporal stratification in active restoration completion.
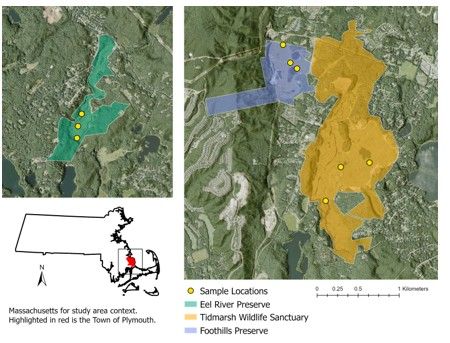
Methods
We placed three PARs at Eel River and Foothills and four at Tidmarsh because Tidmarsh has a larger area than the other two sites. Each recorder was programmed to record for one minute every 10 minutes. In this study, the morning (5 a.m. to 7 a.m.) and the night (6 p.m. to 8 p.m.) had the most active biophony, and these periods were used in the soundscape analysis.
After removing recordings with rain or wind, acoustic indices were calculated, including the Normalized Difference Soundscape Index, Acoustic Complexity Index, Acoustic Diversity Index, Acoustic Evenness, and Biophony Index.
Multiple spatial variables were collected to assess the relationship between the soundscape indices described above and ecological integrity, including microclimatic alterations associated with human-created edge effects (edges), intensity of road traffic in the vicinity (traffic), percent impervious land cover per pixel (imperv), and intensity of agriculture (mowplow), and ecological integrity from the Conservation Assessment and Prioritization System (CAPS) (McGarigal et al. 2020b). As well as the Normalized Difference Vegetation Index (NDVI). Since acoustic indices are most strongly correlated with landscape variables within a radius of 1.5 to 2.5 km, I extracted raster values for each environmental variable within a 2 km spatial vector buffer around each sampling site.
Results:
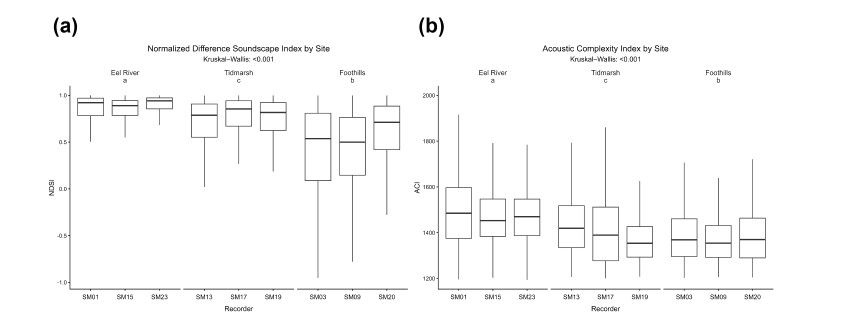
All acoustic indices differed significantly among sites and recorders (KW, >99% confidence). Dunn’s post hoc tests showed that all sites were significantly different from one another for every acoustic index except BI, where Tidmarsh and Foothills were not distinguishable.
At the recorder level, grouping patterns were more variable. Eel River showed the greatest similarity among its three PARs, followed by Foothills, while Tidmarsh exhibited the least similarity among sites.
NDSI, ACI, and BI values were highest at Eel River and lowest at Foothills. ADI was highest at Tidmarsh and lowest at Foothills, while AEI showed the opposite pattern, with the lowest values at Tidmarsh and the highest at Foothills. Older restored sites consistently have higher NDSI and ACI, suggesting that these indices may reflect ecological recovery in these restored wetlands.
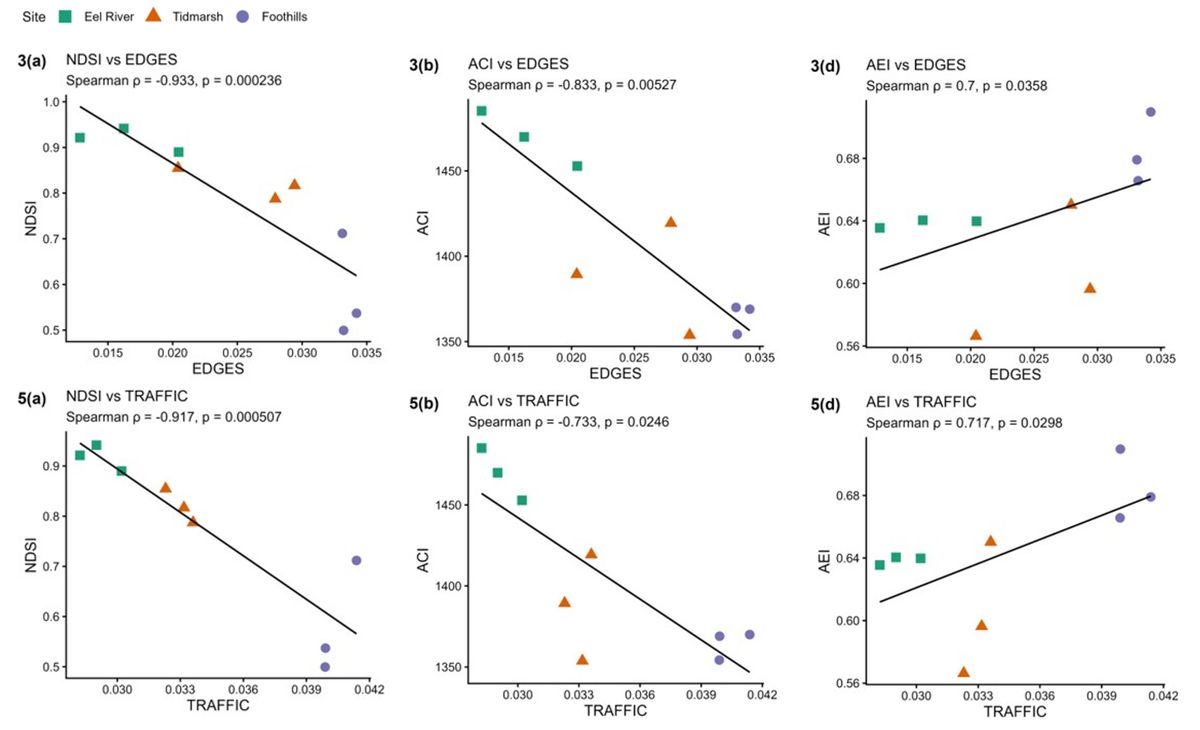
NDSI, ACI, and AEI were related to Traffic and Edges, with increased human impact associated with increased anthropogenic sounds (decreased NDSI) and decreased diversity of acoustic frequencies in the soundscape (decreased ACI). Acoustic evenness (AEI) increased with higher human pressure from edges and traffic. This suggests that the soundscapes respond not only to restoration age but also to the context matrix in which these sites are embedded, particularly to the presence of human pressure.
Conclusion
Acoustic indices, especially NDSI and ACI, serve as reliable indicators of habitat quality by capturing the effects of road traffic, edge influences, and broader environmental context on wetland soundscapes. While other indices are more context-dependent, these measures consistently reflect key ecological conditions. The observed disconnect between landscape metrics and restoration age underscores the value of soundscape monitoring as a direct, scalable approach to assessing ecological recovery, reinforcing its role as a key tool for monitoring wetlands and cranberry bog restoration.
May 22, 2026