User's Guide
Exporting Data
You can now export metadata about locations associated with projects. If a project has a data tab with a table of locations and metadata, there will be an “Export Data” button above the table.
Clicking the button will bring up the Export Database Records dialog:
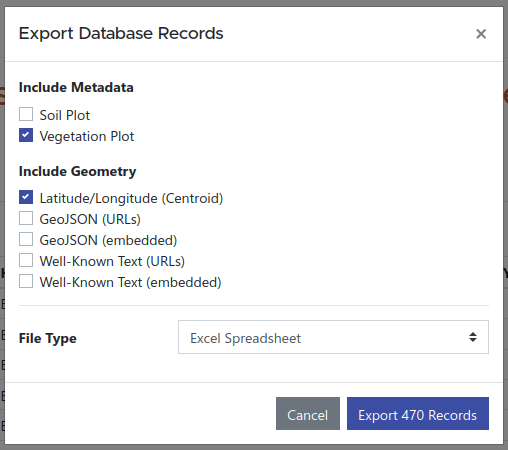
This dialog lets you configure exactly what data you want in the exported file.
Including Metadata Metrics
The Include Metadata section lists all of the associated types associated with the locations in the result set. Checking the box for a location type will include columns for the metrics associated with that location type.
Metrics that are shared between multiple selected location types will only appear once in the results. Metric columns that do not apply to a location because it is not of the selected type will be left blank.
In the above example, data are being exported froma project that has a table of vegetation plots. Some of the locations in the vegetation plot table are also soil plots. Checking the “Soil Plot” checkbox would also include columns with soil plot metadata for the relevant locations.
Including Geometry
The Include Geometry section provides several options for including geographic information for each location. They may be selected in any combination.
Latitude/Longitude (Centroid) will add columns for latitude and longitude to the result. If the location has geometry more complex than a simple point, the center point of the location’s bounding rectangle will be given instead.
GeoJSON (URLs) and Well-Known Text (URLs) will include columns with short links to download the location’s geometry in GeoJSON or Well-Known Text format, respectively. For locations that might have complex geometry (e.g. a property represented by a polygon with hundreds of points) this allows the geometry to be easily accessed by clicking the link (or control-clicking in some spreadsheet software) without including a huge amount of data in each cell.
GeoJSON (embedded) and Well-Known Text (embedded) will include the full geometry representations directly in the spreadsheet cells. Embedded GeoJSON rarely makes sense since it can be quite verbose even for a simple point, but the option is provided if you wish to use it (it is also more useful when exporting in JSON format instead of a spreadsheet). Well-Known Text representations can be compact enough for simple geometry to make sense in a spreadsheet.
File Type
The File Type selector defaults to an Office Open XML XLSX (compatible with Excel) spreadsheet file.
If you intend to process data programatically in an environment such as R or Python, you may find it easier to work with a JSON file, which can be selected from the file type menu. This also includes some extra fields (e.g. object UUIDs) which can be useful for making further queries to the API.
Spreadsheet Format
Exported spreadsheets contain two sheets. The first sheet, called “Data”, contains the exported records. The leftmost column contains the location’s identifier. This is the machine-readable ID for the location, consisting of only letters, numbers, and hyphens, and is the canonical way to refer to the location. The Title column is a human-friendly name for the location, though it may be the same as the identifier. The Type column lists the location types, and the URL column provides a short link to access the page for the location on the web.
These columns are followed by any geometry information you selected, then followed by the metrics associated with the object types you selected in the export dialog.
The second sheet is called “Column Info”. This sheet contains one row for each column in the first sheet, in the same order. The leftmost column is the same as the heading in the Data sheet. The Metric ID column is the machine-readable ID for the metric in the API. This is followed by a description of the metric and, if relevant, human readable unit and machine identifier for the unit in the database.